Author: Nate Silver
Publisher: Mariner Books Information visualization--United States. 1월 2014
ISBN:
9780547974514
Summary: The rise of infographics across virtually all print and electronic media reveals patterns in our lives and worlds in fresh and surprising ways. As we find ourselves in the era of big data, where information moves faster than ever, infographics provide us with quick, often influential bursts of art and knowledge--to digest, tweet, share, go viral. Best American Infographics 2014 captures the finest examples, from the past year, of this mesmerizing new way of seeing and understanding our world. Guest introducer Nate Silver brings his unparalleled expertise and lively analysis to this visually compelling new volume.
Read more...
Author: Yikun Liu
Publisher: The Images Publishing Group Visual storytelling : infographic design in news 1월 2015
ISBN:
9781864706499
Summary: this comprehensive guide is the latest offering in the international data journalism design market. Not only does it introduce the basic elements of data journalism design, traditional design methods and several complex design forms, but it also presents a large number of outstanding works from around the world.

Author: Edward R. Tufte
Publisher: Graphics Pr 7월 2006
Genre: Computers & Internet
Edition: First Edition
Format:
Hardcover
ISBN:
9780961392178
Pages:
213
Summary: I finished tufte last night... what a disaster, or perhaps sunk with high expectations.
I'm a huge fan of dr. tufte's very influential writing on information visualization - as far as I know he's done the best work in the field. But this book - while simply physically and visually stunning - is a real disappointment.
In this work I read about 20% insight, 40% recycled material and preaching to what is probably the choir (this includes an overly repetitious chapter-long discussion of minard's lovely march to moscow graphic & his previously available power point piece), and 40% filler & drek. I don't find his comments on art, writing styles, baseball, and the like to be terribly compelling, and are certainly done better in many other works - and indeed, his thoughts on these ended up as being pretty grating and condescending, if not just wrong.
And that the book ends with several pages of photos (a few of really poor quality, I might add) his own outdoor artwork (which are of passable quality, but what the *bleep* does this have to do with evidence as defined at the front of the book?) only throws salt on the wounds.
This thing is maddeningly inconsistent. I wish I could simply dismiss the work, but it's full of beauty and joy as well as the bad. Sparklines are fun, but could be improved on. Words + images combined inline, some great stuff there. But while some of the really lovely things, like the translations of galileo, are wonderful and exciting to any science-loving person, they really are pretty pointless to the conversation at hand. He has gone straight down since his first major book - a 5+ star effort, the 2nd, 4.5-5 stars, 3rd, 3 stars, and this is about a 2 star one (2.5+ if you haven't read the others.)
If he'd stop believing his sycophants and stop taking himself so seriously in his quest to convince the reader that he's a high priest on a moral crusade it'd be wonderful. He really does try to convince the reader that this topic is of high moral concern - not just sometimes, but in general. I don't buy it.
And you shouldn't buy this if you haven't read his other works (although if you haven't I'll admit you'll probably like this, you just don't know any better ;-)). Read the staggeringly good "The Visual Display of Quantitative Information" or the wonderful "Envisioning Information". And if you must read this, soak up the good points, and try not to grind your teeth with the rest.
Publisher: Monsa Flat illustration.
ISBN:
9788415829898
Author: Sandra Rendgen
Publisher: Taschen America Llc Graphic methods. 1월 2014
ISBN:
9783836548830
Author: Steven Heller
Publisher: Thames & Hudson Graphic arts. 1월 2014
ISBN:
9780500517451
Author: 윈스턴 챙
Publisher: 인사이트 9월 2013
Genre: 국내도서>컴퓨터/모바일>그래픽/멀티미디어>그래픽 일반
ISBN:
8966260888
Pages:
400
Summary: R 기반 환경에서 그래프를 그려야 하는 독자들을 위해, 150개가 넘는 코드를 소개한다. 단순히 그래프를 그리는 방법만을 넘어, 그래프의 각 요소들을 필요에 따라 삭제하거나 수정하는 방법도 알려준다.
Author: Matt Zoller Seitz
Publisher: Abrams The Grand Budapest Hotel 1월 2015
Genre: Interviews
ISBN:
9781419715716
Author: Anita Graser
Publisher: Packt Publishing - ebooks Account 1월 2016
Format:
Softcover
ISBN:
9781785880339
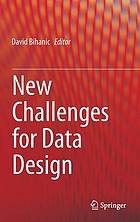
Author: David Bihanic
Publisher: Springer New challenges for data design 1월 2015
Genre: Electronic books
ISBN:
9781447165958
Summary: The present work provides a platform for leading data designers whose vision and creativity help us to anticipate major changes occurring in the data design field, and pre-empt the future. Each of them strives to provide new answers to the question, ℓ́ℓWhat challenges await data design?ℓ́ℓ To avoid falling into too narrow a mind-set, each works hard to elucidate the breadth of data design today and to demonstrate its widespread application across a variety of business sectors. With end users in mind, designer-contributors bring to light the myriad of purposes for which the field was originally intended, forging the bond even further between data design and the aims and intentions of those who contribute to it. The first seven parts of the book outline the scope of data design, and presents a line-up of ℓ́ℓviewpointsℓ́ℓ that highlight this disciplineℓ́ℓs main topics, and offers an in-depth look into practices boasting both foresight and imagination. The eighth and final part features a series of interviews with data designers and artists whose methods embody originality and marked singularity. ℗ℓ As a result, a number of enlightening concepts and bright ideas unfold within the confines of this book to help dispel the thick fog around this new and still relatively unknown discipline. A plethora of equally eye-opening and edifying new terms, words, and key expressions also unfurl. Informing, influencing, and inspiring are just a few of the buzz words belonging to an initiative that is, first and foremost, a creative one, not to mention the possibility to discern the ever-changing and naturally complex nature of todayℓ́ℓs datasphere. ℗ℓ Providing an invaluable and cutting-edge resource for design researchers, this work is also intended for students, professionals and practitioners involved in data design, interaction design, digital & media design, data & information visualization, computer science and engineering.
Read more...
Author: Society For News Design
Publisher: Society for News Design The best of news design. 36. 1월 2015
Genre: Periodicals
ISBN:
9781631591105
Summary: The Best of News Design 36th Edition, the latest edition in Rockport's highly respected series, presents the winning entries from the Society for News Design's 2015 competition.
Author: Valentina D'efilippo, James Ball
Publisher: Collins 6월 2013
Genre: Academic History
Format:
Hardcover
ISBN:
9780007506156
Pages:
224
Summary: Title: Infographic History of the World Binding: Hardcover Author: James Ball Publisher: HARPER COLLINS PUBLISHERS
Author: David Mccandless
Publisher: Harper Design New York 1월 2012
ISBN:
9780062236524
Summary: The bestselling classic has been revised and updated! A colorful guide to the world's most consequential trivia, Visual Miscellaneum by David McCandless is a reference book like no other. It now includes 18 all new graphs and 23 updated ones. It helps us make sense of our world by putting the data we are bombarded with every day -- health findings, technological advances, cultural touch points, war statistics -- into creative visual perspective. Like Show Me How by Lauren Smith and Schott's Miscellany, only more complete and satisfying, Visual Miscellaneum is a treat for the mind and the eye. Using cutting edge graphs, charts, and illustrations, author David McCandless creatively visualizes the world's most surprising relationships and compelling data. - Publisher.
Read more...
Author: Shan ben tu shu
Publisher: Sendpoints Publishing Co Information made beautiful : infographic design
ISBN:
9789881383464
Summary: Work from over 100 designers and studios includes projects for clients such as Wired Italy, the Royal Mail, Money Today, Lionsgate Entertainment, Ronald McDonald House, and the UN, as well as universities, research facilities, and private clients. These pieces range from abstract to hands-on, and break down information ranging from the status of female children in India and global water usage to coffee bean maps covering the amount of caffeine consumed in the US and crocheted diagrams of time spent crafting on German public transportation.
Read more...
Author: Antonis Antoniou
Publisher: Berlin Die Gestalten Verlag Mind the Map Creative Mapmaking and Cartography 1월 2015
ISBN:
9783899555882
Author: Shaoqiang Wang
Publisher: Promopress Infographics : designing and visualizing data = design et visualisation de l'information = diseño y 1월 2014
Genre: Pictorial works
ISBN:
9788415967248
Author: David Mccandless
Publisher: Harper Design Knowledge is beautiful 1월 2014
Genre: Pictorial works
ISBN:
9780062188229
Summary: Delves into the world of visualized data where stunning infographics that blend the facts with their connections, contexts, and relationships make information meaningful, entertaining, and beautiful."In this sequel to the bestselling book The Visual Miscellaneum, author David McCandless uses stunning and unique visuals to reveal unexpected insights into how the world really works. Every day, every hour, every minute we are bombarded with information, from television, from newspapers, from the Internet, we're steeped in it. We need a way to relate to it. Enter David McCandless and his stunning infographics, simple, elegant ways to interact with information too complex or abstract to grasp any way but visually. McCandless creates visually stunning displays that blend the facts with their connections, contexts, and relationships, making information meaningful, entertaining, and beautiful. And his genius is as much in finding fresh ways to provocatively combine datasets as it is in finding new ways to show the results."--Publisher information.
Read more...
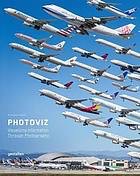
Author: Nicholas Felton
Publisher: Gestalten Photoviz : visualizing information through photography 1월 2016
ISBN:
9783899556452
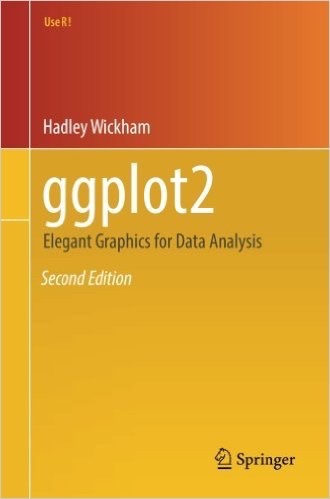
Author: Hadley Wickham
Publisher: Cham Springer International Publishing ggplot2 : Elegant Graphics for Data Analysis 1월 2016
ISBN:
9783319242750
Pages:
260
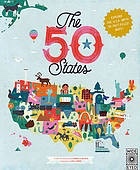
Author: Gabrielle Balkan
Publisher: Wide Eyed Editions The 50 states : explore the U.S.A. with 50 fact-filled maps! 1월 2015
Genre: Maps, Miscellanea, Juvenile works, Miscellanea Juvenile literature, Maps Juvenile literature
ISBN:
9781847807113
Summary: Be inspired by the inventiveness, beauty and diversity of the United States in this colorful collection of fact-filled maps. Explore thousands of locations and be awed by the achievements of hundreds of people who helped make America what it is today.